Introducing GM SOTA stats
All the numbers
Time for some more streamlit apps calculating SOTA numbers! I came up with this after several different but similar questions were being asked - who’s winning the GM/SI contest, I’d completed GM/ES and was interested to see who else had done it, Tim, G5OLD, ticking off Corbetts, the race to complete CNP, and my general interest in who’s done what when. So whilst I answered these questions individually, I wanted to make something a little more generic.
The data
Given there are 1,219 summits in Scotland, and many activations, querying the API live and computing the various stats probably wasn’t going to be a good idea. My GM/SI app loads all the activations from the SI summits, and that takes a while. Using Streamlit does mean the results are cached on the server, but the free tier means the service goes to sleep after a while and it has to download them all again. To get around this, I wrote a script to query the API and save the results to a file, which is then loaded by the app. This means the app loads in seconds, and the data is updated nightly via a Github action.
It starts at the association level, then iterates through the regions to get all the summits, then gets all the activations per summit and squashes it all together into a single JSON file. In previous apps, I’ve used sotlas’ API to lookup the userId (sic) to the callsign in the database. This is because this API end point on sotadata is behind authorisation (although the reversed isn’t). This time I decided to copy sotlas’ method for building this table and just downloading the full honour roll each night. The script then looks up the callsign from this and updates the big json of all activations. It gets commited to the repo, and then the streamlit app can load it.
The summits
Aside from the obvious regional stats - like ES, CS etc., I also wanted to look at summits split up in a couple of ways. So far this includes, Munros, Corbetts and the Cairngorms National Park. The regions are easy, as the sota database already defines those, but the others, I have made a list of each of them. This was a bit of a journey into the wonderfully specific world of hill classification, but Hill Bagging website has all the data you could ever need, and it was just the case of joining these lists up with the SOTA summits. A while back I’d added all the SOTA references to OSM, and I could then use that to help generate a list.
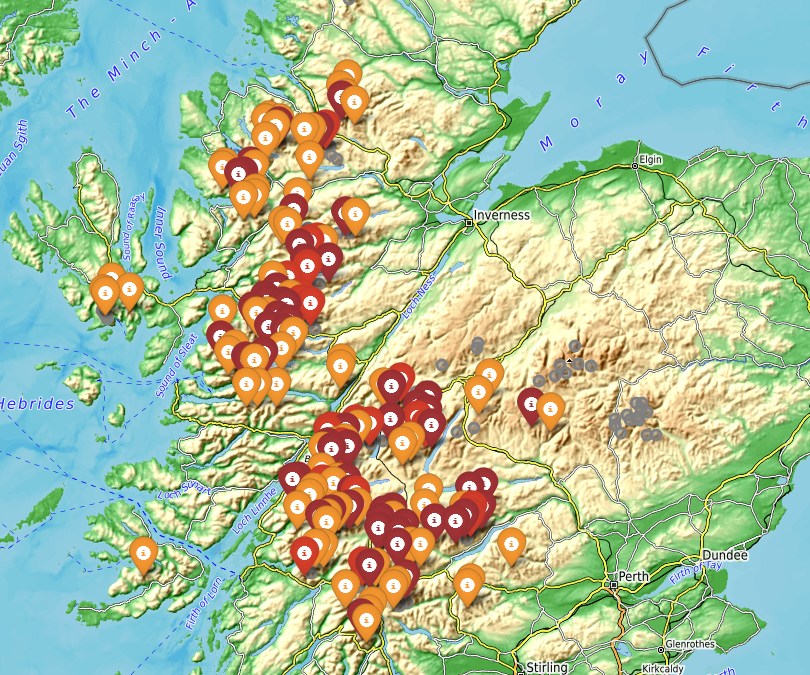
The other odd one out are the Munros. As these are only described by their height being over 3000 ft and nothing about prominence (150m of which is required for SOTA), there are many of them which aren’t SOTA summits but I thought would be good to show on the map too. Often you can climb a couple of non-SOTA munros at the same time as a SOTA one. Again, I made a list of these to be able to reference, and the show on the unactivated summits map as little grey circles.
The logic
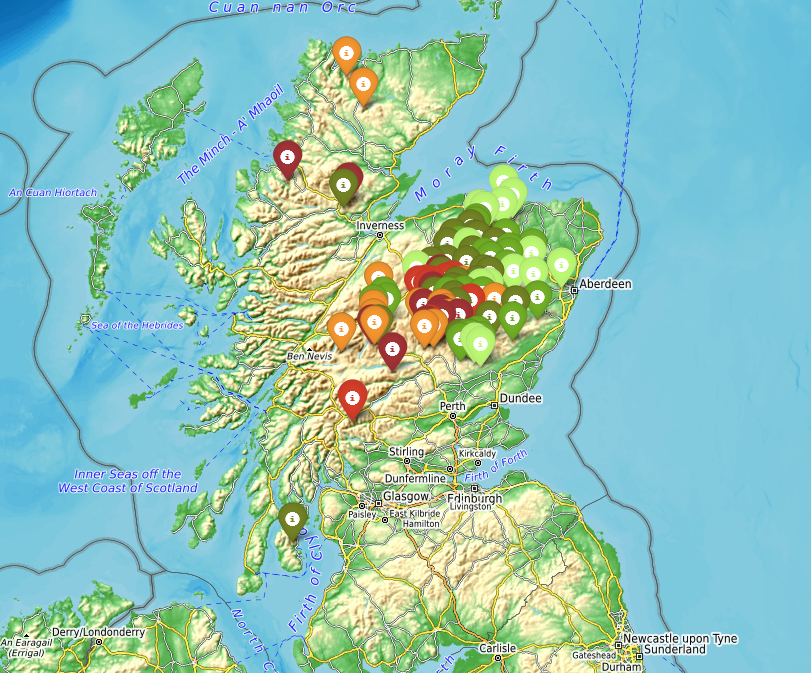
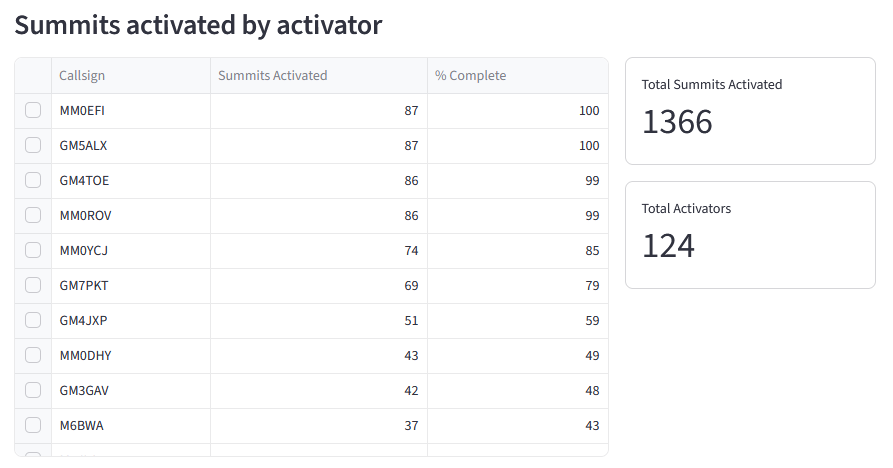
Once I had all the data, then it was time to put together some tables and charts. It’s fairly simple at the moment. You can pick a hill set, and a year (or all of hills/years) and it shows who has done what activations. Selecting an activator from the table, then shows a map of the summits they’ve done and the ones they haven’t (if you pick all time, as you can activate the same summit once a year). It gets a bit busy when you pick all of Scotland over all years!
There’s a couple of other tables showing the stats over all years for the hill set and some counts of activations. These things answered what I was interested in seeing and so I haven’t done much else with it.
Future work
I did use the data downloaded to look up multi-summit activations, and tabulate the data from that analysis. I was curious to see (a) who has done the most summits in one day and (b) what are common multi-summit days that I might want to do. I added up points and made another csv that I could filter in Excel. I did think about adding this analysis to the app, so others could see it. The code for it is in the repo, so just a case of integrating it into the streamlit app, but yet to do anything.
No doubt people who activate outside of GM would be interested in their own association stats. That wouldn’t be too hard to add, although I’m then downloading more and more data from the sotadata API each night.
I’ve also thought about combining all these various tools into a single app, and maybe selfhosting so that it doesn’t go to sleep and I can leverage the data across multiple tools. However, I don’t think there’s enough demand to warrant that and I like making discrete apps for each question and Streamlit saves me bothering with hosting etc. If I could convert it all to javascript vs. python then maybe I wouldn’t have to rely on Streamlit but again, I don’t think it’s worth the effort.
The App
Enough waffle🧇…go enjoy it yourself!. If you do have any ideas I’m always interested, particularly if it’s seeing data in new lights that you can’t easily see elsewhere.