SOTA API and Google AI to find the Goat
Lots of data to play with
After my double activation yesterday (which I’ve yet to write up), I bumped into Fraser, MM0EFI of RadioRover YouTube fame, in Tesco. He was asking when I was going to be doing some higher point summits, as mostly I’ve been doing ones near to the house which don’t score that high. There are quite a few in my region. After browsing sotl.as some more, I was curious as to how long it took Fraser to reach Mountain Goat. This is the award you get when you reach 1,000 points.
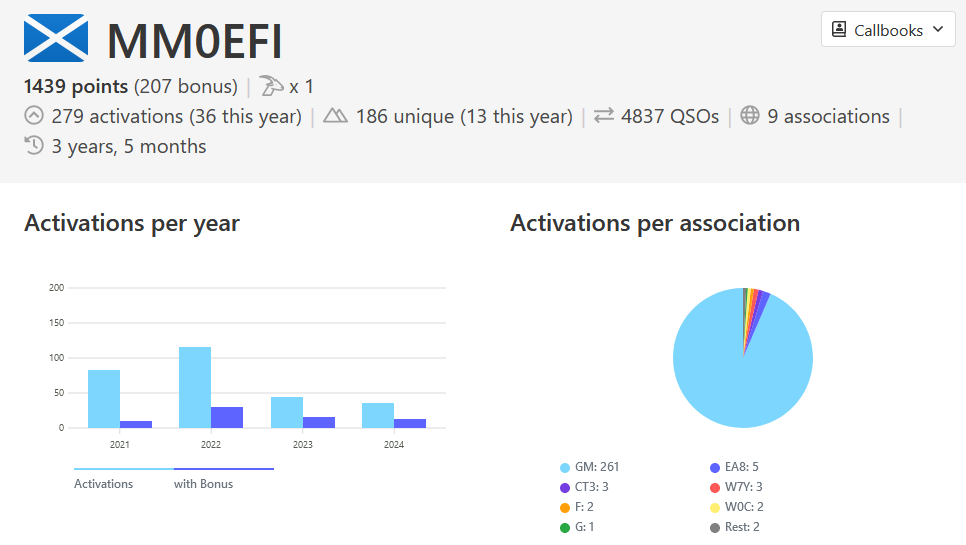
You can see his activation list on sotl.as, and it’s clear he’s done a lot of summits and a lot of high pointers. However, the question still remained…how long did it take?
I know the SOTA database has an API, as several other sites use it and I’ve seen it mentioned in the reflector, but I hadn’t come across any documentation. Searching around I find this post which gets me started. I work out MM is associationID 03, and then querying https://api-db.sota.org.uk/admin/activator_roll?associationID=03, I can look up Fraser’s UserID.
In the past I’ve used python to query APIs, put the JSON into a pandas dataframe then calculate and plot things from there. A quick way to get going with this is in Google Colaboratory. It’s a free jupyter notebook in which many python packages are already installed and it’s quick to jump in and get going. Unsurprisingly, it now features a LLM AI assistant, where you can just type in what you want and it generates several options of code for you to run and see what happens.
My first prompt (including spelling mistakes but now corrected) was:
retreive JSON from api url: https://api-db.sota.org.uk/admin/activator_log_by_id?year=all&id and create a plot of “Total”
Option #2 of Gemini spat out some commented code, I tweaked the date column name, as it just guessed it was called Date not ActivatorDate, and tah-dah ✨
import requests
import json
import pandas as pd
import matplotlib.pyplot as plt

url = "https://api-db.sota.org.uk/admin/activator_log_by_id?year=all&id="

# Define the ID you want to retrieve data for
activator_id = "46844"

# Construct the full URL
full_url = url + activator_id

# Send the GET request
response = requests.get(full_url)

# Parse the JSON response
data = json.loads(response.text)

# Create a Pandas DataFrame
df = pd.DataFrame(data)

# Convert the "ActivationDate" column to datetime
df["ActivationDate"] = pd.to_datetime(df["ActivationDate"])

# Plot the cumulative sum of "Total"
df.plot(x="ActivationDate", y="Total", kind="line", figsize=(10, 6))
plt.title("Cumulative Sum of Total for Activator ID: {}".format(activator_id))
plt.xlabel("Date")
plt.ylabel("Total")
plt.show()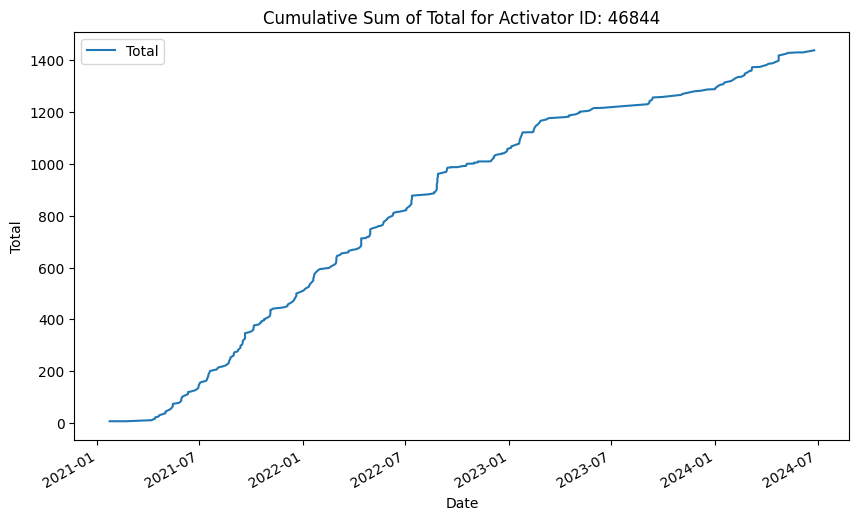
Certainly the trend of a mountain goat! Although I’d say once he reached 1,000 the pressure was off and you can see that gradient relax.
But how long did it take?
The actual question that was asked
So I asked Gemini some more questions and we find the answers:
# prompt: duration in activationdate between start and when total=1000

# Find the first row where Total is greater than or equal to 1000
first_1000_row = df.loc[df["Total"] >= 1000].iloc[0]

# Calculate the duration between the first activation date and the date when Total reached 1000
duration = first_1000_row["ActivationDate"] - df["ActivationDate"].iloc[0]

# Print the duration
print("Duration until Total reached 1000:", duration)
Plus question #2:
# prompt: what row of df has total = 1000

# Find the index of the first row where Total is greater than or equal to 1000
first_1000_row_index = df.loc[df["Total"] >= 1000].index[0]

# Print the index
print("Row index with Total equal to 1000:", first_1000_row_index)
🥁633 days and 172 activations 🎉
I’m at 16 points right now 😅⛰️🐐